Tutorial 8: Comparing algorithms and statistics
Comparing algorithms fairly
already showed the minimal honest comparison: many seeds, a paired
Wilcoxon test, an effect size. This tutorial goes one step further — three
algorithms, several problems, and sezgi.run_experiment's TOML-grid
surface, the shipped tool for a real multi-algorithm study.
Multi-seed runs, by hand first
Before reaching for run_experiment, the mechanics are just repeated
.run() calls with a different seed each time — the same wrapper-class
call from Tutorial 1, looped:
import sezgi

problem = sezgi.bbob(1, 5, 1)
budget = 500
seeds = range(10)

de_gaps = [sezgi.DifferentialEvolution(pop_size=20).run(problem, budget=budget, seed=s).gap
           for s in seeds]
cmaes_gaps = [sezgi.CMAES(pop_size=20).run(problem, budget=budget, seed=s).gap
              for s in seeds]

print(f"diff_evolution: mean gap over {len(seeds)} seeds = {sum(de_gaps)/len(de_gaps):.6g}")
print(f"cmaes:          mean gap over {len(seeds)} seeds = {sum(cmaes_gaps)/len(cmaes_gaps):.6g}")

w = sezgi.stats.wilcoxon(de_gaps, cmaes_gaps)
print(f"wilcoxon signed-rank: p_value={w['p_value']:.4g} method={w['method']}")
diff_evolution: mean gap over 10 seeds = 0.0759183 cmaes: mean gap over 10 seeds = 0.0128171 wilcoxon signed-rank: p_value=0.001953 method=exact
This is exactly the pattern Learn 5
teaches — paired per-seed gaps, one signed-rank test. It scales to two
algorithms on one problem. For three or more algorithms across several
problems, sezgi.run_experiment is the tool built for the job.
run_experiment: a TOML grid of algorithms x problems x seeds
sezgi.run_experiment(spec_toml) runs an ExperimentSpec (parsed from
TOML) across every (algorithm, problem, seed) combination and returns
one record dict per run — algo, fid, dim, instance, seed,
budget, best_f, f_opt, gap, evals_used, wall_secs:
import sezgi

spec_toml = """
name = "tutorial-8-comparison"
seeds = [1, 2, 3, 4, 5]
budgets = [500]

[[algorithms]]
name = "de_rand_1"
preset = { kind = "de_rand_1", pop_size = 20 }

[[algorithms]]
name = "cmaes"
preset = { kind = "cmaes", pop_size = 20 }

[[algorithms]]
name = "random_search"
preset = { kind = "random_search", pop_size = 20 }

[[problems]]
suite = "bbob"
fid = 1
dim = 5
instances = [1, 2, 3, 4, 5]
"""

records = sezgi.run_experiment(spec_toml, parallel=True)
r0 = records[0]
print(f"records: {len(records)}  (3 algorithms x 5 instances x 5 seeds)")
print(f"one record: algo={r0['algo']} fid={r0['fid']} dim={r0['dim']} "
      f"instance={r0['instance']} seed={r0['seed']} budget={r0['budget']} "
      f"best_f={r0['best_f']:.6g} gap={r0['gap']:.6g} evals_used={r0['evals_used']}")
records: 75 (3 algorithms x 5 instances x 5 seeds) one record: algo=de_rand_1 fid=1 dim=5 instance=1 seed=1 budget=500 best_f=-125.932 gap=0.0172281 evals_used=500
(wall_secs -- one more field every record carries -- is omitted from the
line above deliberately: it is real wall-clock timing, so it is the one
field in a record that is NOT reproducible run to run, unlike every other
field here.)
sezgi.results_matrix(records, budget) aggregates those per-seed records
into one (algo_names, problem_labels, matrix) triple — matrix[i][j] is
the aggregated gap of algorithm j on problem i, ready to feed
sezgi.stats.friedman (3+ algorithms, non-parametric, a
repeated-measures-ANOVA alternative) directly:
import sezgi

spec_toml = """
name = "tutorial-8-comparison"
seeds = [1, 2, 3, 4, 5]
budgets = [500]

[[algorithms]]
name = "de_rand_1"
preset = { kind = "de_rand_1", pop_size = 20 }

[[algorithms]]
name = "cmaes"
preset = { kind = "cmaes", pop_size = 20 }

[[algorithms]]
name = "random_search"
preset = { kind = "random_search", pop_size = 20 }

[[problems]]
suite = "bbob"
fid = 1
dim = 5
instances = [1, 2, 3, 4, 5]
"""

records = sezgi.run_experiment(spec_toml, parallel=True)
algo_names, problem_labels, matrix = sezgi.results_matrix(records, budget=500)
friedman = sezgi.stats.friedman(matrix)

print(f"algorithms: {algo_names}")
print(f"problems:   {problem_labels}")
print(f"friedman statistic={friedman['statistic']:.4g} p_value={friedman['p_value']:.4g}")
for name, rank in zip(algo_names, friedman["mean_ranks"]):
    print(f"  mean_rank[{name}] = {rank:.3g}")
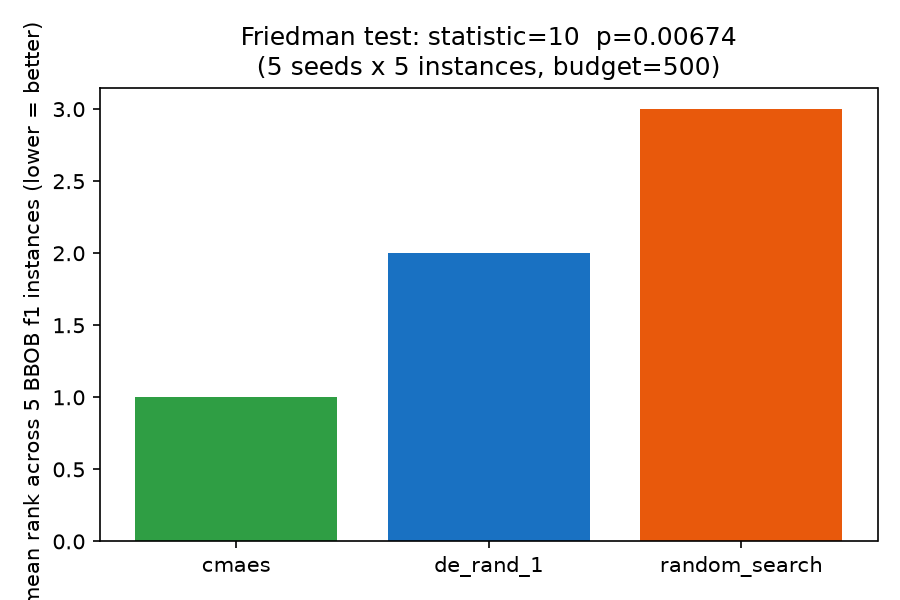
algorithms: ['de_rand_1', 'cmaes', 'random_search'] problems: ['f1d5i1', 'f1d5i2', 'f1d5i3', 'f1d5i4', 'f1d5i5'] friedman statistic=10 p_value=0.006738 mean_rank[de_rand_1] = 2 mean_rank[cmaes] = 1 mean_rank[random_search] = 3
Lower mean_ranks is better. At p_value < 0.05 the null hypothesis
("all three algorithms perform the same") is rejected at this budget, on
this one BBOB function's five instances — still a small illustration (a
real study sweeps several functions and dimensions with many more seeds),
but the mechanics — the TOML grid, results_matrix, stats.friedman —
are the real ones sezgi ships.
The mean ranks, visually
The one-call bundle: stats.paper_package
For a paper-ready bundle in one call — Friedman + Nemenyi CD, pairwise
Wilcoxon with Holm correction, pairwise Cliff's delta, and (optionally)
Bayesian signed-rank/Plackett-Luce, all at once —
sezgi.per_budget_packages(records, rope=0.01, samples=10000, seed=42)
builds one sezgi.stats.paper_package PER DISTINCT BUDGET present in
records (never pooled across budgets: rankings can flip between small
and large budgets, so each budget gets its own package). See the
Statistics API reference for the full test surface, and
Comparing algorithms fairly
for the fuller pipeline diagram.
Next
This closes the tutorial track. Every figure across this site is generated
by a seeded script under docs/scripts/, with its plotted data gated by
py-sezgi/tests/test_docs_figures.py — re-running any fig_*.py script
reproduces its committed sidecar exactly. From here:
- Examples gallery — real, runnable scripts covering this same ground and more.
- API reference: Statistics — the full
sezgi.stats.*test surface this tutorial only sampled.