Example 17: Plotting with bulanik.plot
Figures of a fuzzy number, an orthopair number, a linguistic scale, a Mamdani system and an MCDM ranking, each in a light and a dark theme.
Needs an extra
This example uses the plot extra (pip install "bulanik[plot]"). The documentation build installs it, so the output below is real.
Source
examples/17_plotting.py
"""Plots with bulanik.plot: fuzzy numbers, a scale, inference and MCDM, in light and dark.

Needs the plot extra (pip install "bulanik[plot]"). The figures are written to a
temporary directory; open them to see the house style.
"""

import os
import tempfile
from pathlib import Path

os.environ.setdefault("MPLBACKEND", "Agg")  # draw off-screen; no window opens

from bulanik import IFN, PFN, TFN, TrFN, plot  # noqa: E402
from bulanik.inference import MamdaniFIS  # noqa: E402
from bulanik.mcdm import ahp, topsis  # noqa: E402
from bulanik.scales import EXAMPLE_TFN_7  # noqa: E402
from bulanik.sets import LinguisticVariable, triangular  # noqa: E402

service = LinguisticVariable(
    "service",
    (0, 10),
    {"poor": triangular(0, 0, 5), "average": triangular(0, 5, 10), "good": triangular(5, 10, 10)},
)
food = LinguisticVariable("food", (0, 10), {"rancid": triangular(0, 0, 5), "delicious": triangular(5, 10, 10)})
tip = LinguisticVariable(
    "tip",
    (0, 30),
    {"cheap": triangular(0, 5, 10), "average": triangular(10, 15, 20), "generous": triangular(20, 25, 30)},
)
fis = MamdaniFIS(
    [service, food],
    [tip],
    [
        "IF service IS poor OR food IS rancid THEN tip IS cheap",
        "IF service IS average THEN tip IS average",
        "IF service IS good OR food IS delicious THEN tip IS generous",
    ],
)
weights = ahp([[1, 3, 5], [1 / 3, 1, 3], [1 / 5, 1 / 3, 1]], criteria=["price", "quality", "delivery"])
ranking = topsis([[250, 16, 12], [200, 16, 8], [300, 32, 16], [275, 32, 8]], weights, ["cost", "benefit", "benefit"])

figures = {
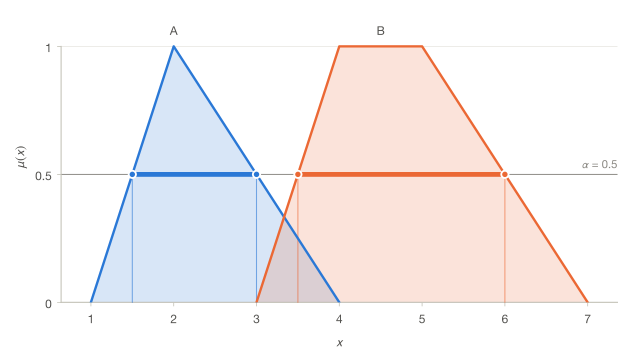
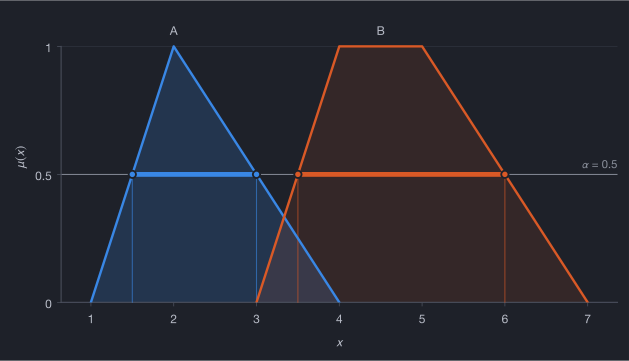
    "membership": lambda: plot.membership([TFN(1, 2, 4), TrFN(3, 4, 5, 7)], labels=["A", "B"], alpha_cut=0.5),
    "orthopair": lambda: plot.orthopair(
        [IFN(0.6, 0.3), PFN(0.7, 0.6)], regions=(1, 2, 3), labels=["IFN", "PFN"], hesitancy=True
    ),
    "scale": lambda: plot.variable(EXAMPLE_TFN_7, x=4),
    "mamdani": lambda: plot.mamdani_output(fis, {"service": 3, "food": 8}),
    "ranking": lambda: plot.ranking(ranking),
}

out = Path(tempfile.mkdtemp(prefix="bulanik-plots-"))
saved = []
for mode in ("light", "dark"):
    with plot.theme(mode):
        for name, draw in figures.items():
            ax = draw()
            path = out / f"{name}-{mode}.svg"
            ax.figure.savefig(path)
            saved.append(path)
for p in saved:
    print(p)
print(f"saved {len(saved)} figures")
Output
Run when this page is built:
<tmp>/membership-light.svg
<tmp>/orthopair-light.svg
<tmp>/scale-light.svg
<tmp>/mamdani-light.svg
<tmp>/ranking-light.svg
<tmp>/membership-dark.svg
<tmp>/orthopair-dark.svg
<tmp>/scale-dark.svg
<tmp>/mamdani-dark.svg
<tmp>/ranking-dark.svg
saved 10 figures
The first figure the script saves, membership-light.svg and membership-dark.svg
(shown in your colour scheme; the docs build ships the same plot.membership call as a committed figure):
What to notice
- Every plot function takes an
axand returns it, so figures compose with ordinary matplotlib. - Each figure is saved twice, once per theme; the files go to a temporary directory (shown as
<tmp>below) and the docs gallery shows the same style. bulanik.plotneeds theplotextra and matplotlib.
Go further
- Guide: Fuzzy numbers, visually
- API:
bulanik.plot
Run it yourself: python examples/17_plotting.py.