Fuzzy numbers, visually
Each figure on this page shows one idea about fuzzy numbers. They are drawn
with bulanik.plot, so you can make the same pictures from
your own numbers. bulanik computes every value in them: α-cuts, sums,
products, scores and aggregates. The figures follow your colour scheme; switch
between light and dark mode to see the other variant.
How these figures are made
The scripts are in docs/scripts/. Each one calls bulanik.plot and then
adds titles and annotations. Regenerate all the figures with
uv run --group docs python docs/scripts/build_figures.py. Each figure is
written as a light and a dark SVG, and the output is deterministic.
Triangular and trapezoidal numbers
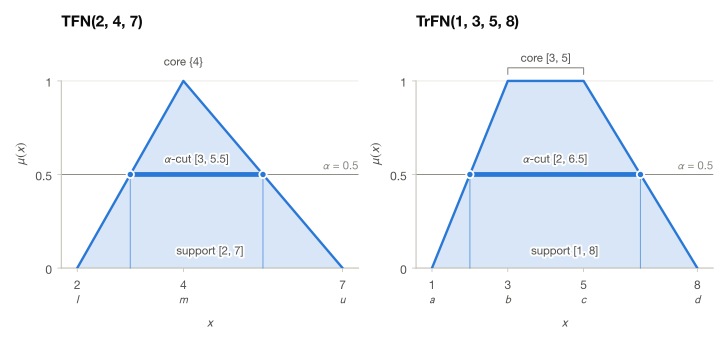
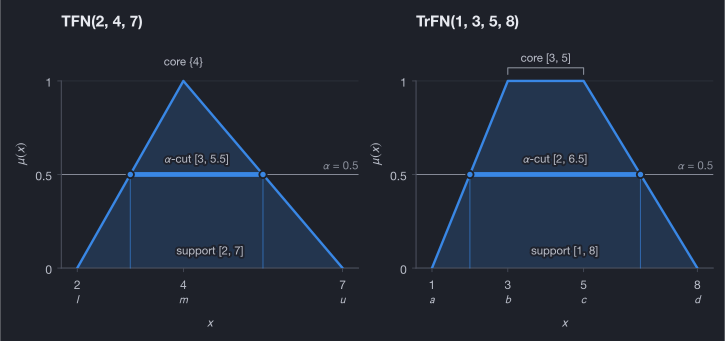
alpha_cut(0.5). See
Triangular numbers.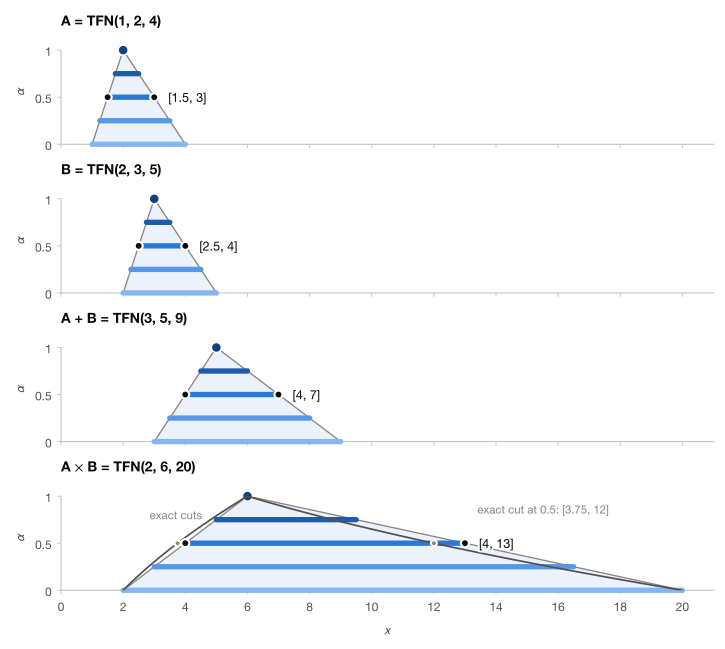
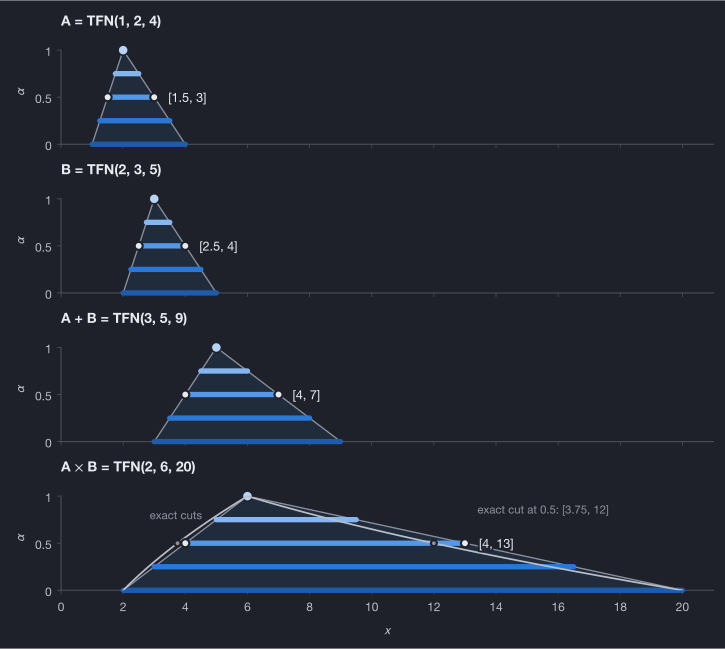
A * B returns the triangle
through its corner products: at α = 0.5 that gives [4, 13] where the exact
cut is [3.75, 12]. See TFN.mul.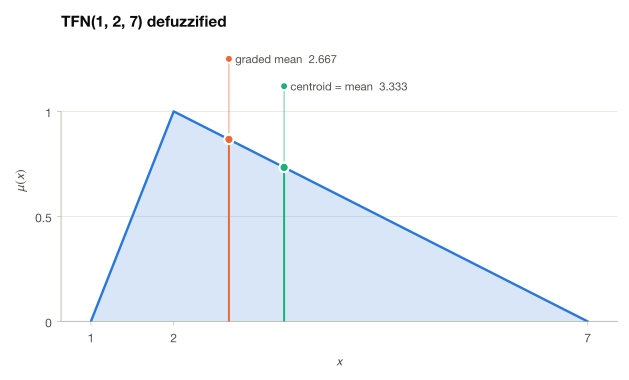
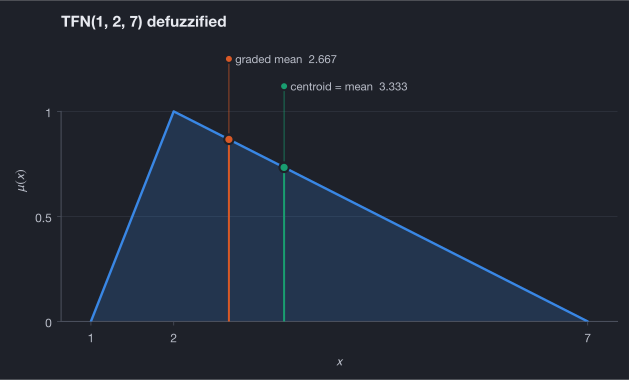
score turns a number into
one crisp value, and the method you choose matters for a skewed number. The
graded mean weights the peak four times, so it stays near m. For a triangle
the centroid equals the mean (l + m + u)/3, which the long right tail pulls
further out.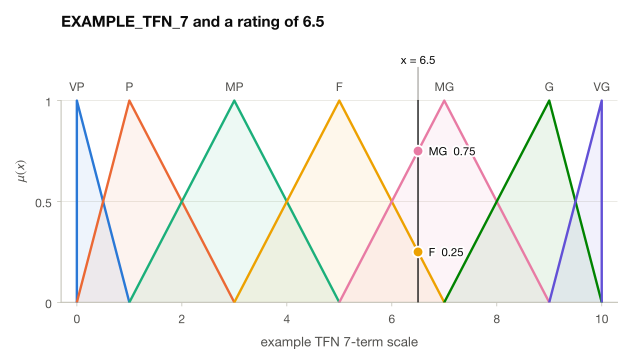
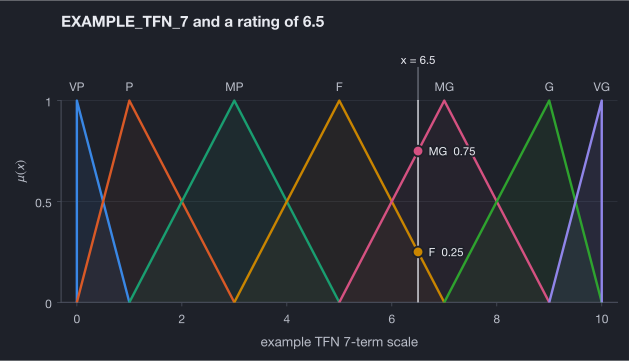
EXAMPLE_TFN_7 maps seven
words to triangles. Neighbouring terms overlap, so a crisp rating belongs
partly to two words: 6.5 is "MG" to degree 0.75 and "F" to degree 0.25. Drawn
with plot.variable; see
Sets and scales.Orthopair numbers
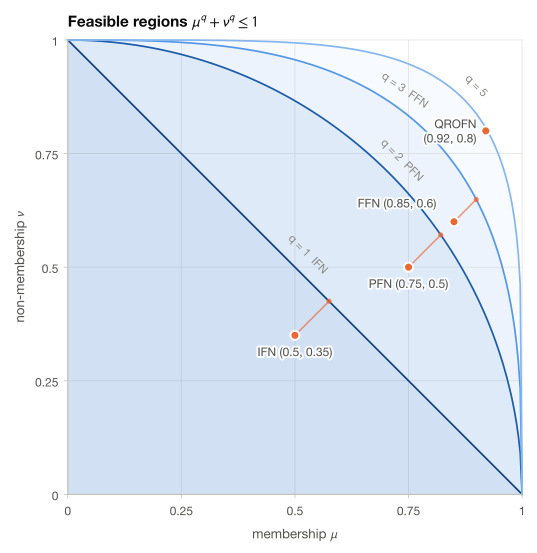
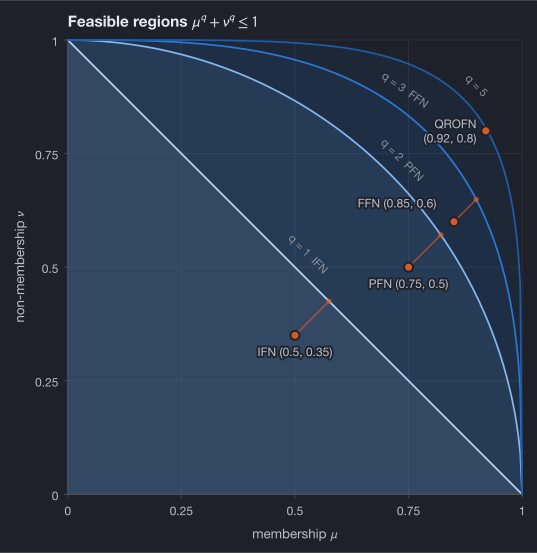
π. See
Orthopair numbers.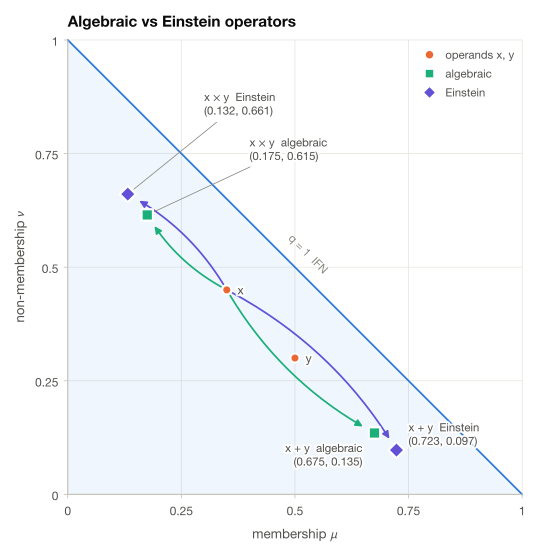
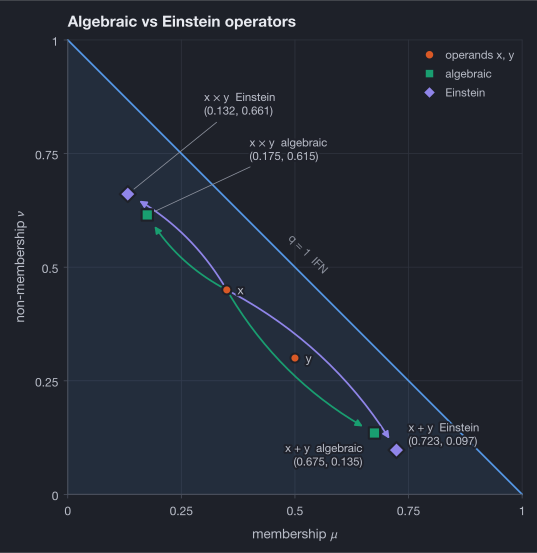
ops="einstein") move further than the algebraic
default in both directions: the Einstein t-conorm is larger than the
algebraic one, and its t-norm is smaller. See
QROFN.add and
QROFN.mul.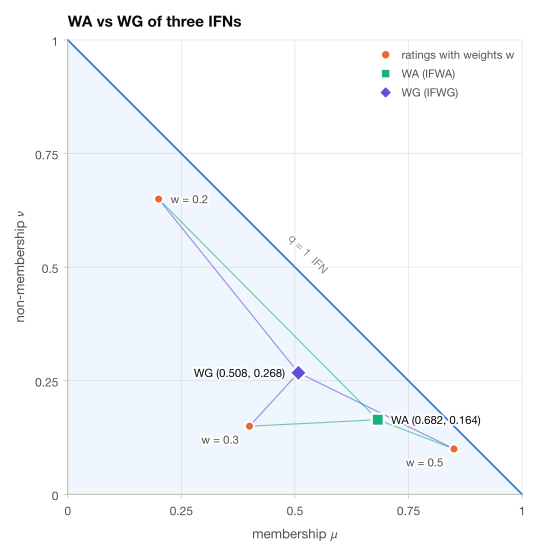
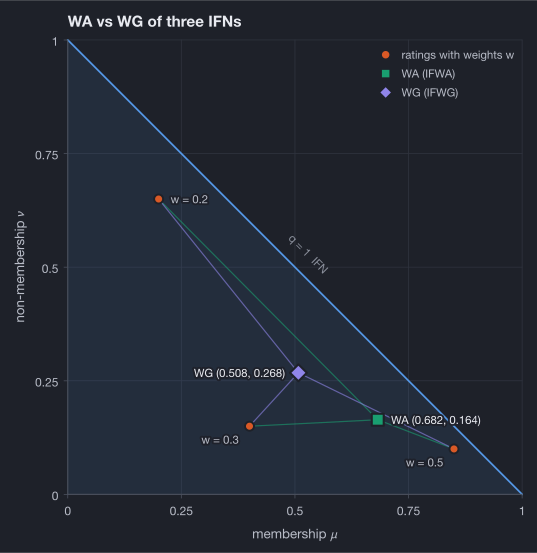
wa and
wg combine the three ratings with the same weights. They
disagree in a systematic way. The weighted average (IFWA) leans to the high
membership of the heaviest rating. The geometric mean (IFWG) is pulled toward
the weak ratings, so it lands at lower μ and higher ν. See
Aggregation.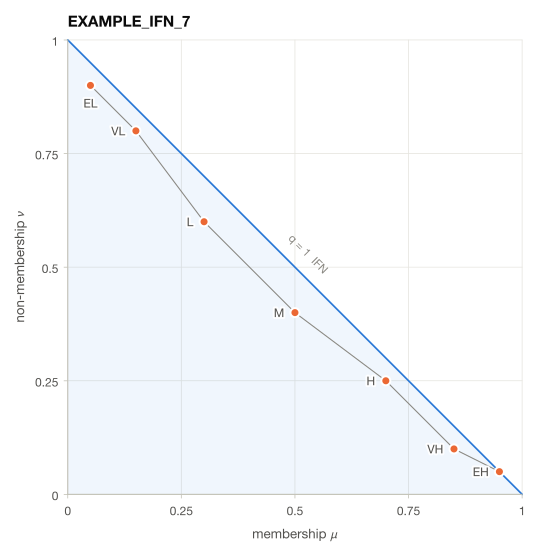
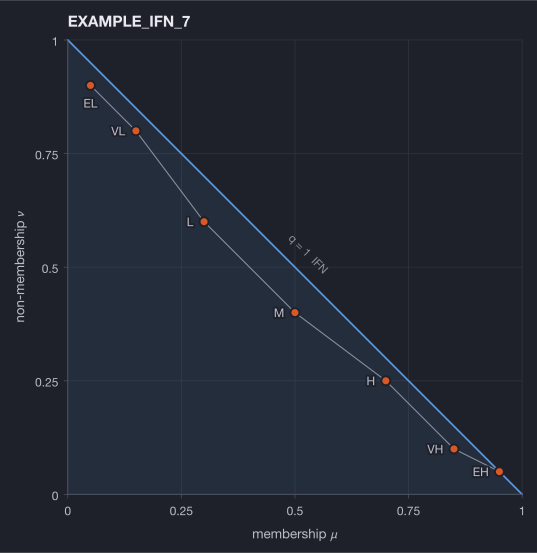
EXAMPLE_IFN_7 runs
from "EL" (extremely low) to "EH" (extremely high), and the hairline joins the
terms in scale order. The distance of a term from the boundary μ + ν = 1 is
its hesitancy. "L" and "M" have the most (π = 0.1), and "EH" lies on the
boundary (π = 0).Three-part numbers
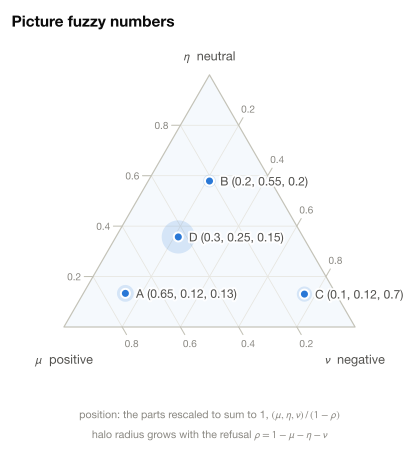
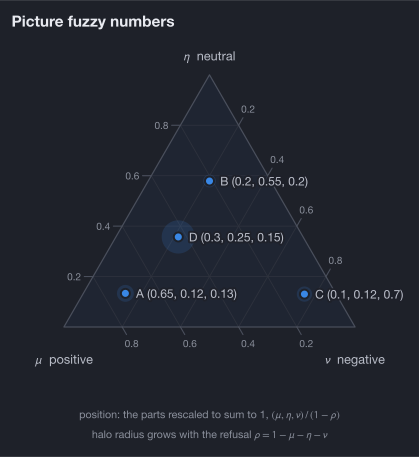
PictureFN splits a
judgement into positive μ, neutral η and negative ν. The rest,
ρ = 1 − μ − η − ν, is refusal. Each point sits at its parts rescaled to sum to
1, (μ, η, ν)/(1 − ρ), so the grid reads the rescaled shares and the labels give
the parts themselves: D (0.3, 0.25, 0.15) sits on the η ≈ 0.36 line. The halo
grows with ρ, and D leaves the most unsaid (ρ = 0.3). See
Three-part numbers.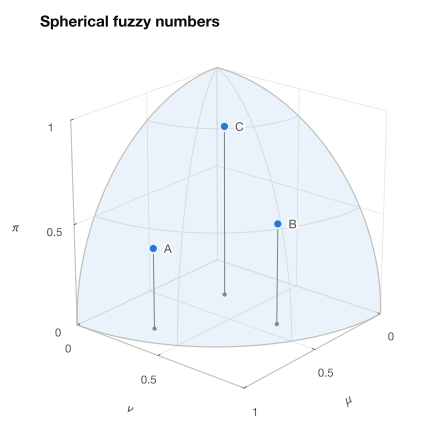
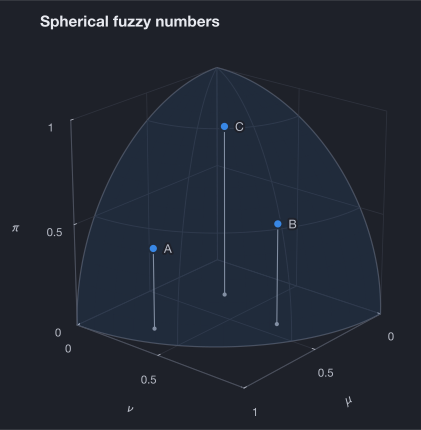
SphericalFN
(μ, ν, π) only needs μ² + ν² + π² ≤ 1, so it can be any point of the unit
ball's positive octant. A = (0.8, 0.3, 0.4), B = (0.4, 0.7, 0.5) and
C = (0.3, 0.3, 0.85) are drawn with drop lines to the μ–ν floor so you can
read their depth. C sits high on the π axis: mostly hesitant.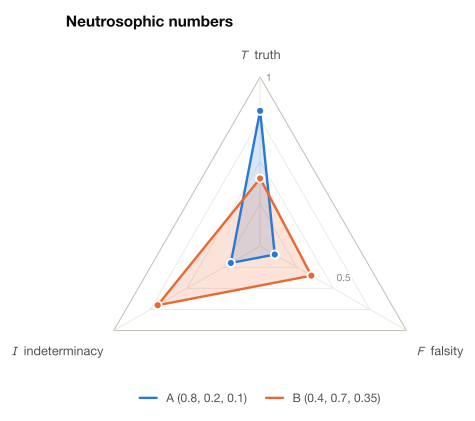
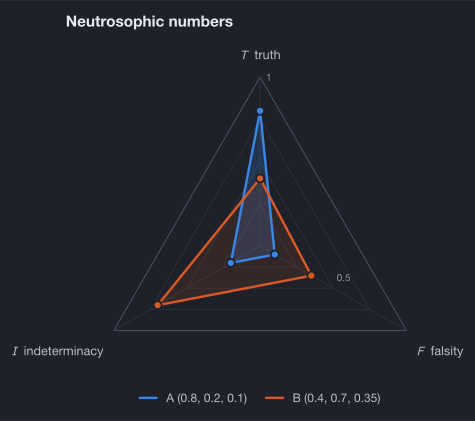
NeutrosophicFN are independent; each can be
anywhere in [0, 1]. A radar triangle shows all three at once. A is a
confident "true", and B is mostly indeterminate.Interval-valued orthopair numbers
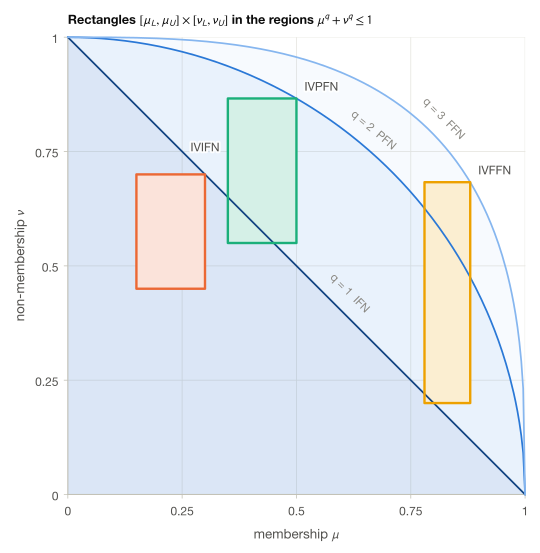
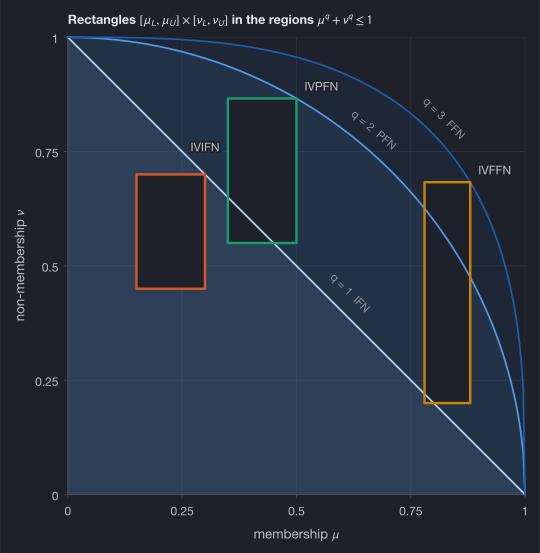
IVIFN,
IVPFN, IVFFN) each have their
upper-right corner on the boundary of their own rung: μU = 0.3 on q = 1,
0.5 on q = 2 and 0.88 on q = 3. Only that corner has to satisfy
μUq + νUq ≤ 1, and then the whole rectangle
lies inside the region.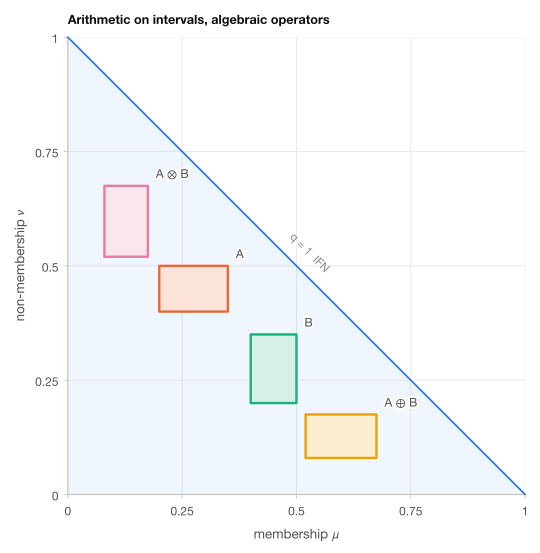
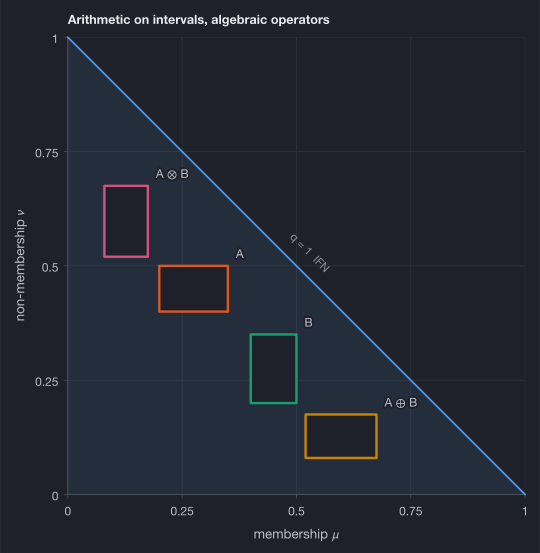
IVQROFN.add and
IVQROFN.mul.Interval type-2 numbers
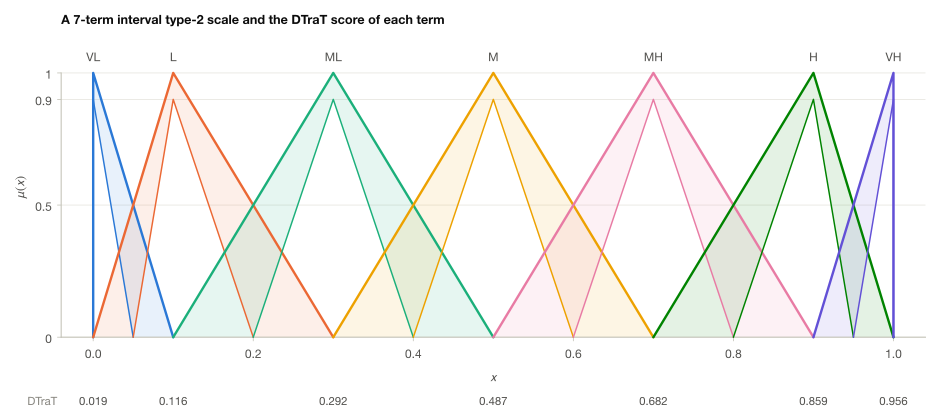
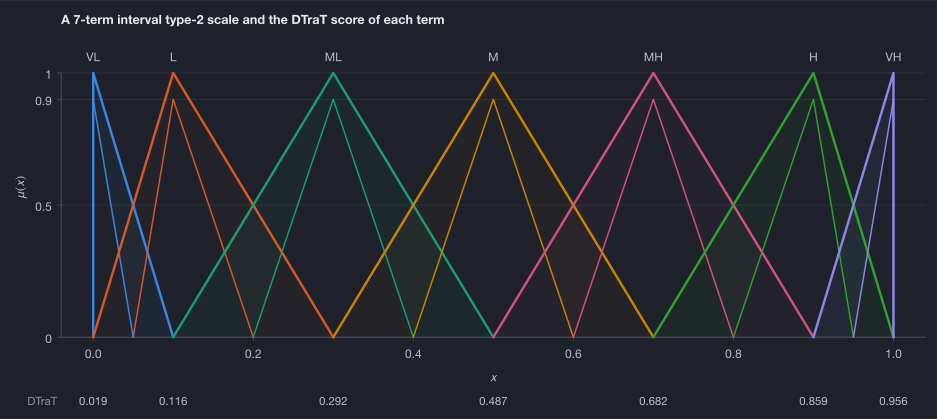
IT2TrFN: an upper trapezoid (bold line), a lower trapezoid
that is nested inside it (thin line) and, between them, the footprint of uncertainty
(the wash). The numbers under the axis are the DTraT scores that bulanik computes for
each term, which turn the type-2 term into one crisp value. The seven terms
form an illustrative scale in the style of the interval type-2 TOPSIS
literature (Chen and Lee 2010,
doi:10.1016/j.eswa.2009.09.012). The values are not a transcription of any one
published table.DEMATEL
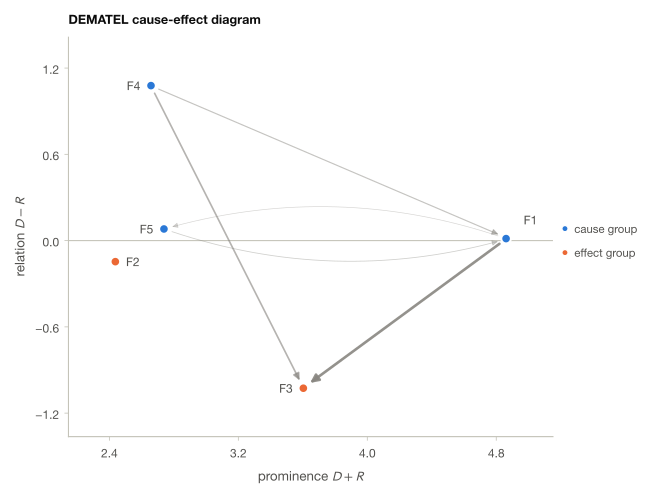
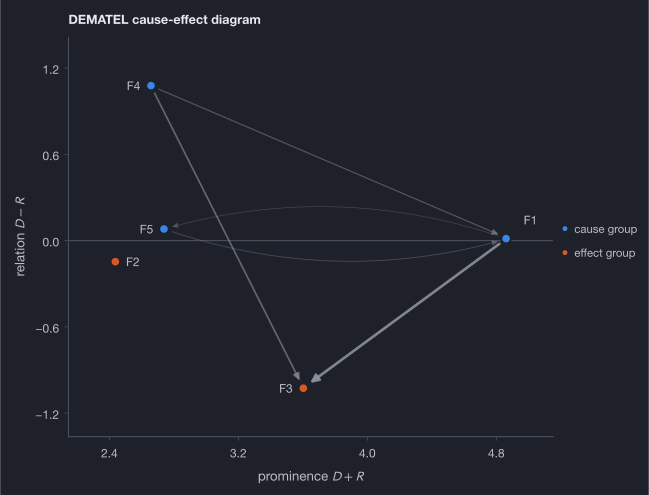
dematel goes through dematel. Each factor is
placed by its prominence D + R (how involved it is) and its relation D − R (above the
line, a net giver of influence). F1, F4 and F5 are causes, and F2 and F3 are effects.
Arrows mark the total influences above 0.45; the default threshold, the mean of T
(0.33), would draw 13 of them. See plot.dematel.